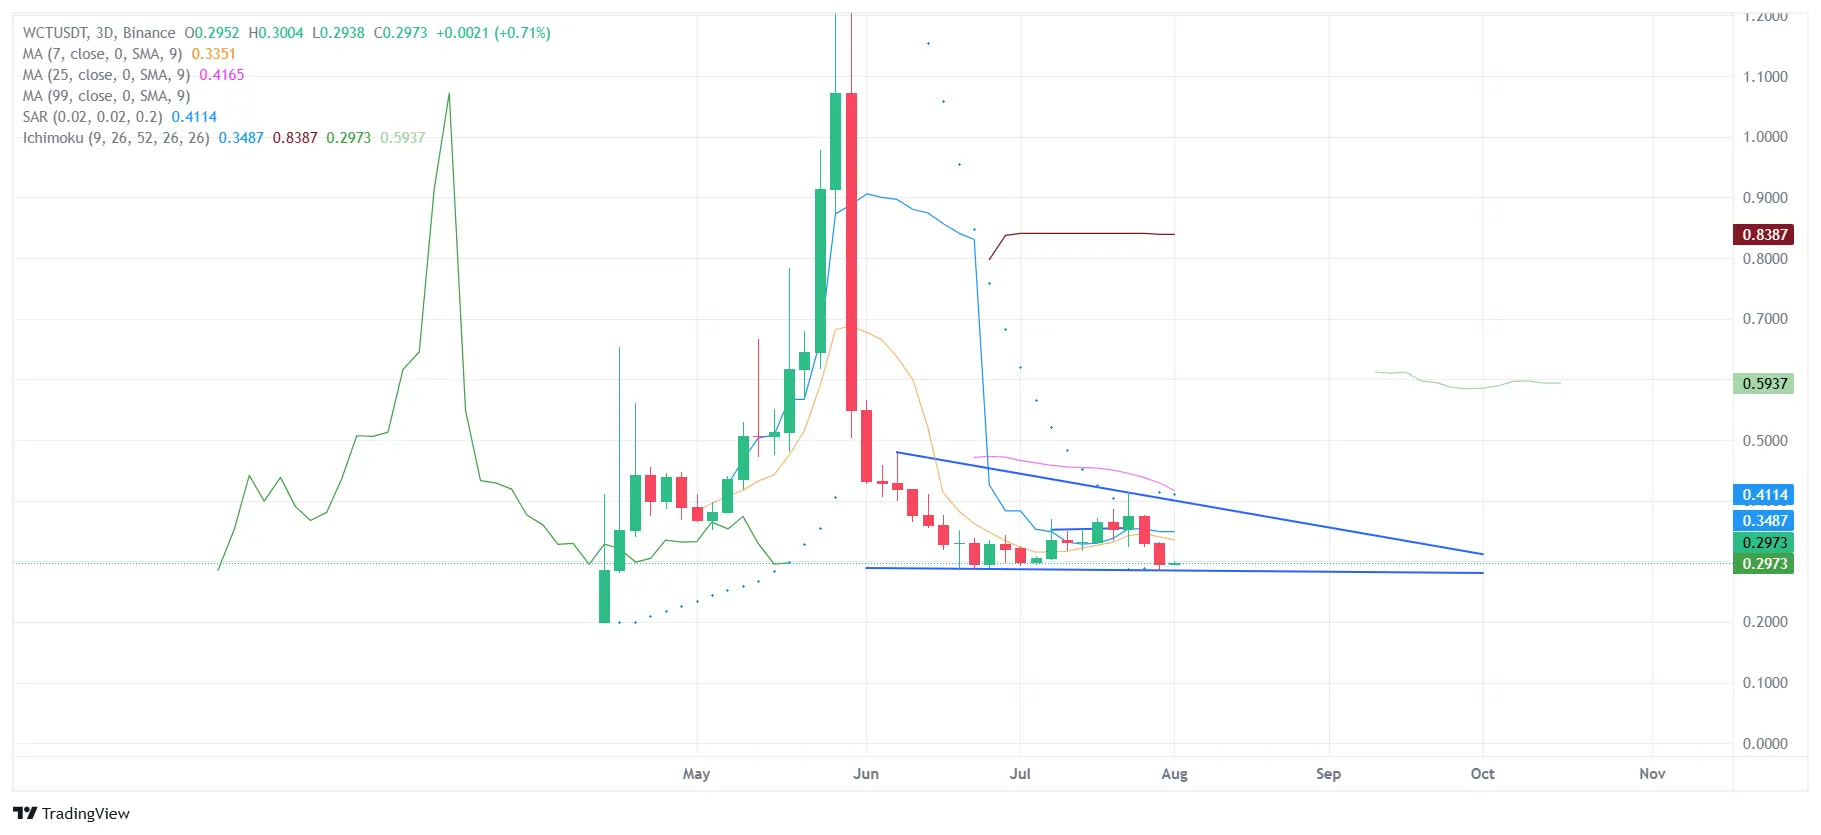
🔍 Analysis of the asset WCT/USDT 3D The WCT/USDT asset is in a consolidation phase after a strong downward impulse. Current price: 0.2973 USDT. 📉 Technical picture: The price holds horizontal support around 0.29, forming a potential double bottom zone — this may indicate preparation for a reversal. The downward trend remains in force: the resistance line ( blue ) indicates a decrease in highs. MA 7 (0.3351), MA 25 (0.4165) and MA 99 — all above prices, confirming the bearish sentiment. SAR (0.4114) is also above the prices — 📍 signal of persistent selling pressure. Ishimoku: Price is below
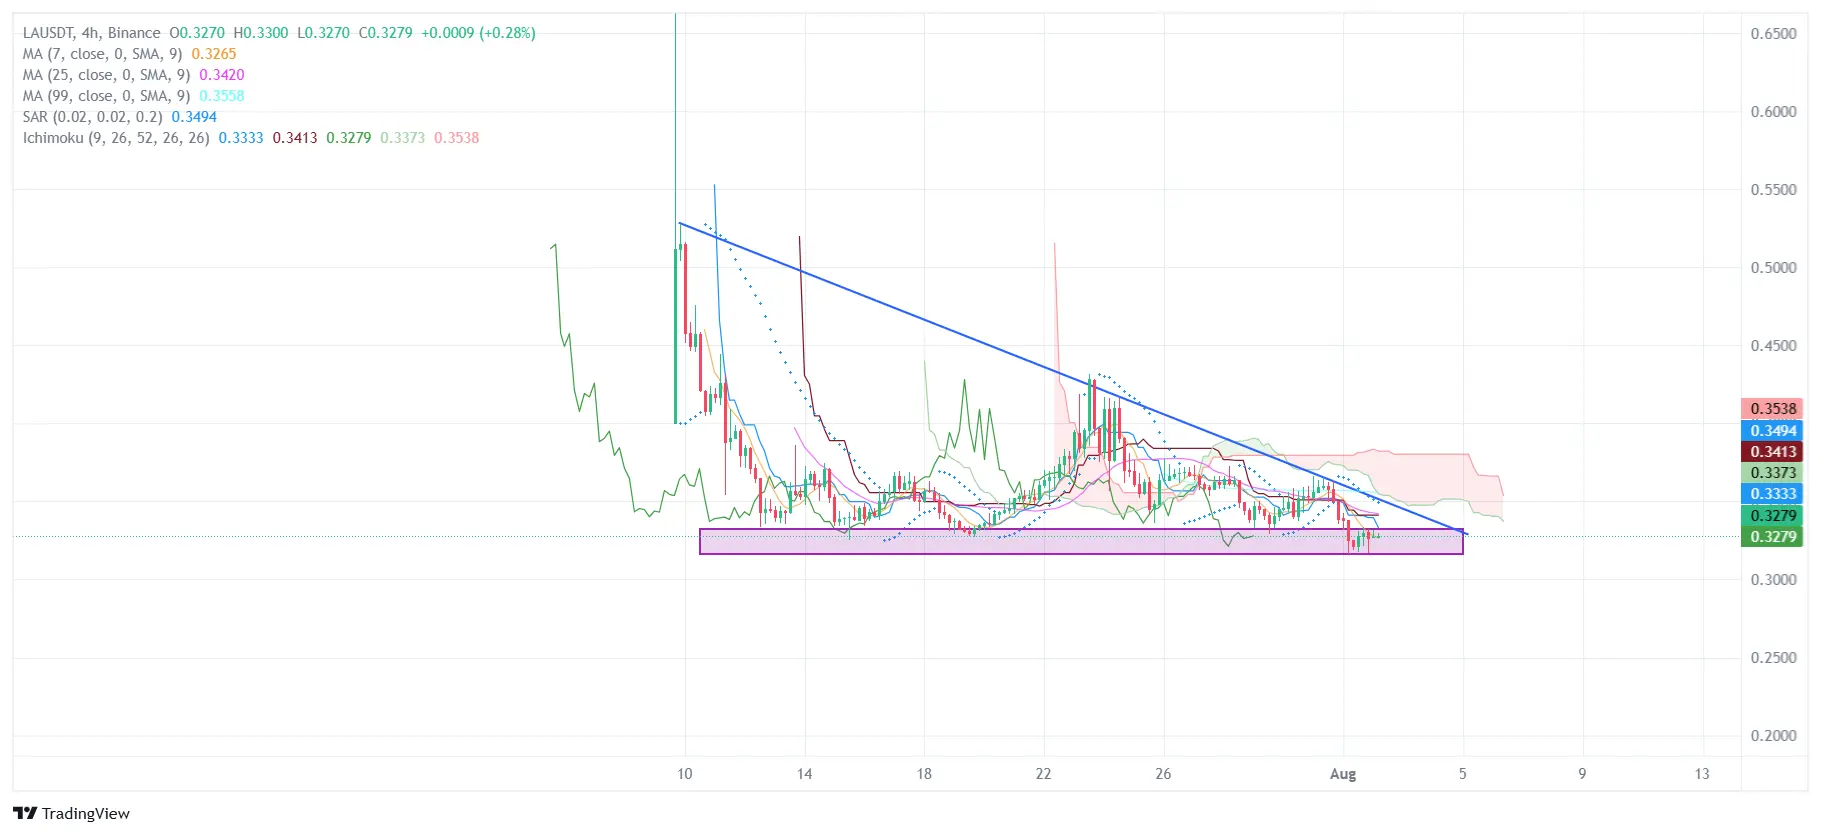
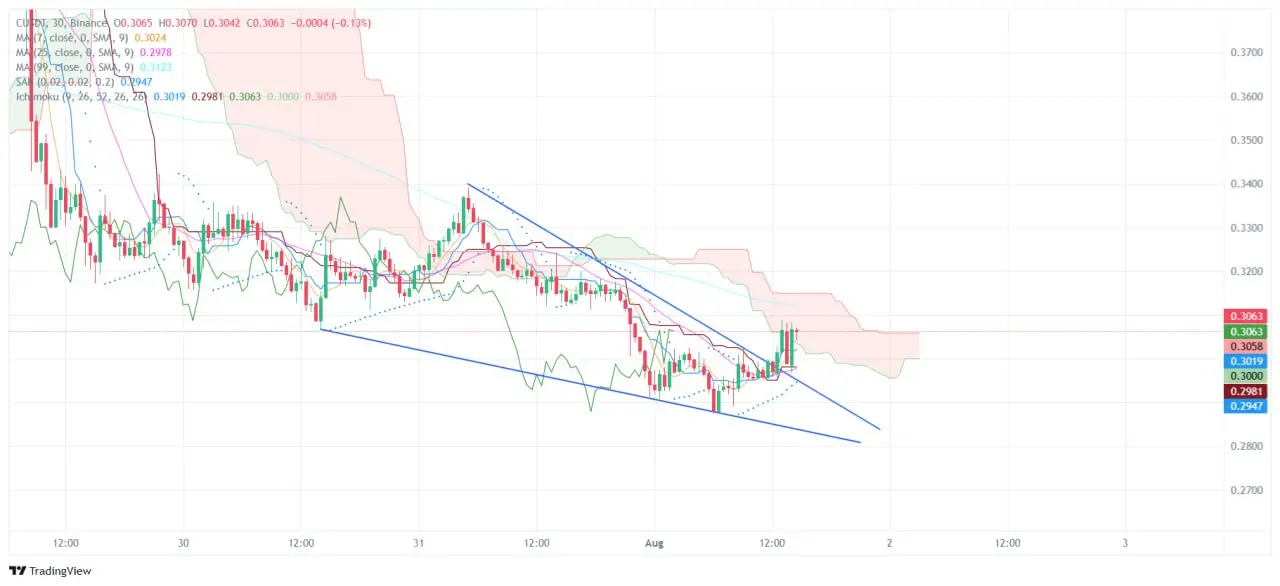
📉 Technical Analysis LA/USDT (4H): Consolidation at support — is the impulse near? On the 4-hour timeframe, LA/USDT is experiencing a prolonged downward trend, constrained by diagonal resistance (🔵 blue line ), while the support zone (🟪 purple block ) around 0.318–0.327 remains a key accumulation zone. 📊 Key Technical Signals: 🔻 Descending Triangle: The formation is narrowing, and the price is squeezed between the descending resistance line and the horizontal support. This indicates a consolidation phase preceding a potential impulse. 📉 Moving Averages (MA 7, 25, 99): • The price is belo
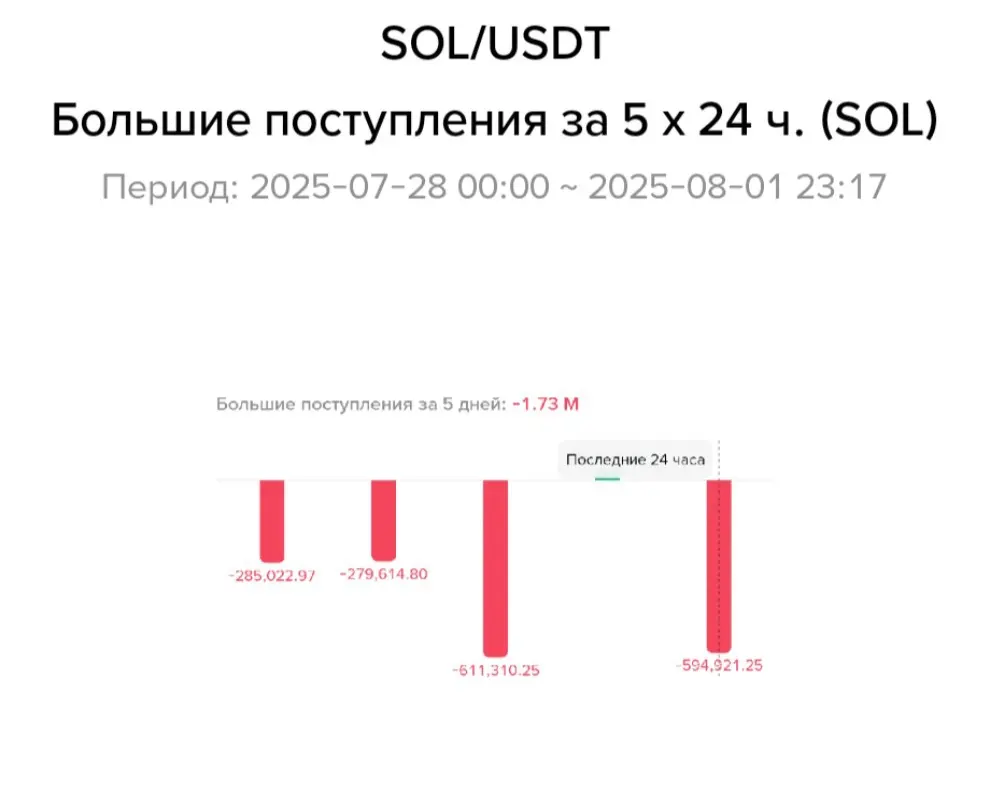
📊 SOL/USDT — large outflows of 1.73M SOL in 5 days Outflow over the last 24 hours: -594K SOL 🚨 This may signal increased pressure from sellers and possible profit-taking by large participants. Technically — the risk of further price decline in the short term is increased.
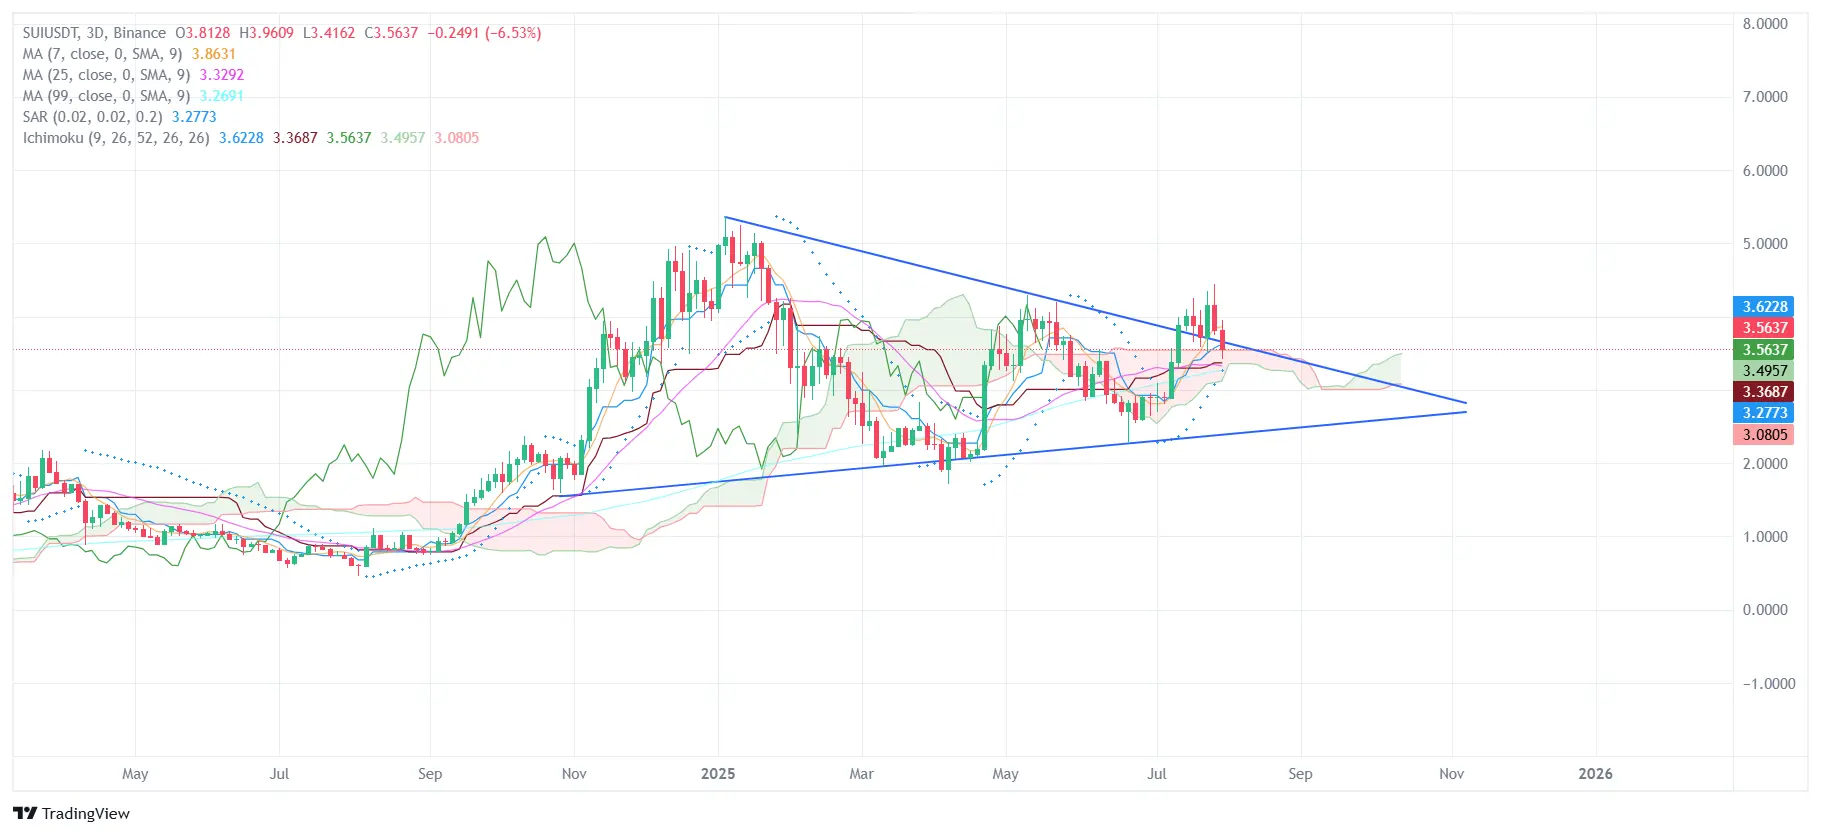
📊 Analysis $SUI/USDT 3D 🔺 A symmetrical triangle is forming — a consolidation zone before a strong movement.💥 The recent attempt to break upward turned out to be false, and the price returned to the figure. 📌 Current price: $3.56📈 Resistance: $3.86 – $4.00📉 Support: $3.27 – $3.33☁️ Price in Ichimoku cloud — neutral zone.📉 MA(7/25/99) converging → market narrowing. 🔮 Scenarios: 🟢 Bullish: Holding above $3.95 → target $5.50 – $6.00 🚀 🔴 Bearish: Break down to $3.27 → return to $2.60 – $2.30 ⚠️ ⏳ SUI is approaching a point of tension in the triangle. A breakout from the range will lead
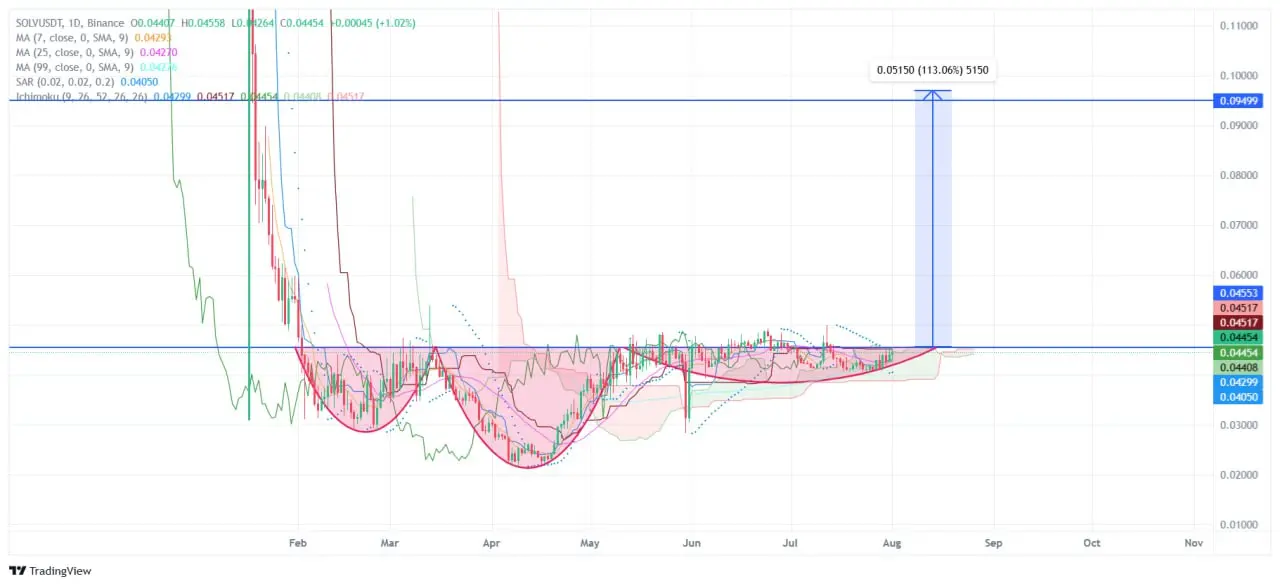
📈 $SOLV — on the verge of a breakthrough! Analyzing $SOLV/USDT 1D 🔸 A powerful bullish pattern is forming — "double cup with handle" 🔸 Key resistance — zone $0.045–0.046 🔸 Breaking through this zone opens the way to $0.095 (+113%) Technical picture: ✅ Price above the Ichimoku cloud ✅ MA(7/25/99) under price — support ✅ SAR indicates an increase ✅ Volume is accumulating — a momentum is possible 📌 Growth potential: 2x+ 📉 Stop - under the zone $0.041 🔔 We are waiting for consolidation above $0.046 for entry.
📉 Technical Analysis of the asset C/USDT: Descending Wedge 📈 The chart is forming a "descending wedge" pattern, which is often considered a bullish reversal pattern. Two converging downward trend lines narrow the price movement — a potential signal for a breakout upward. 📊 Indicators: MA 7, 25, 99: The price is below all MAs, confirming a downward trend; however, MA 7 crosses MA 25 from below to above — a possible early reversal. Ichimoku: Price is below the cloud, which strengthens the bearish scenario. Chikou Span is below the price - the trend is still downward. However, the thin cloud m
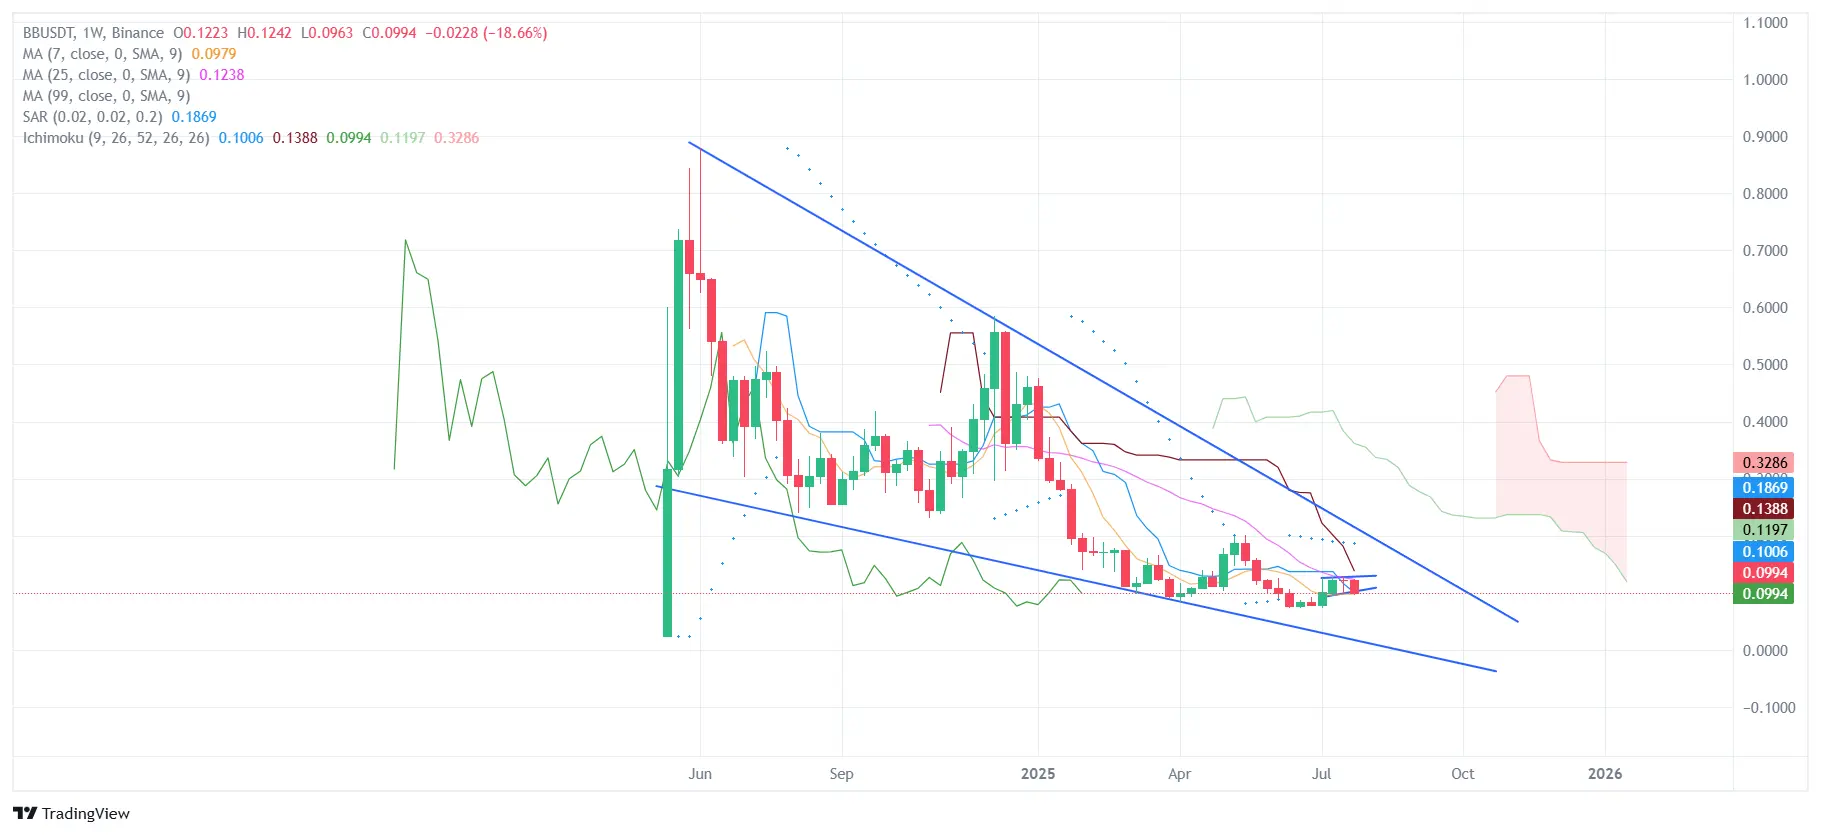
🧠 Technical Analysis BB/USD (1W): pressure is increasing 📉 On the weekly chart of the asset BB/USD, a clear downward trend is observed, forming a descending triangle with a resistance line (🔵 blue diagonal ). After a strong growth in June 2025, the asset entered a consolidation phase, where each new high was lower than the previous one, and support was maintained in the range of $0.094–0.138. 📉 August 2025: The price has broken through the key support at $0.094, which is a worrying signal for the bulls. However, the breakout has not been confirmed by increased volumes, but the current move
"Hello everyone! I hope you're all having a great day. I'm excited to be part of this amazing community. Let's connect, share knowledge, and grow together. Looking forward to learning new things and engaging in positive discussions. Wishing everyone success and happiness in everything you do!"
#WalletConnect # $WCT Web3 scale in numbers 📊 WalletConnect processed over 300 million connections, engaging 47.5 million unique users! This is the real scale of Web3 infrastructure. The protocol is becoming the standard for security and usability in the industry. With $WCT, new roles are emerging in the ecosystem — from validators to delegates.
#BounceBitPrime# $BB 🌐 Scalable L1 network with EVM support BounceBit is built on its own L1 network compatible with EVM, which makes it easy to develop and deploy smart contracts. This paves the way for numerous DApp projects focused on BTC liquidity. Such architecture makes the platform user-friendly for both developers and investors. 🛠⚙️
#Caldera# $ERA Integrations are one of Caldera's strong points. The platform is already working with EigenDA, Celestia, Arbitrum, and OP Stack. This opens up access for projects to the best technologies in the industry without the need to write low-level code. And the automation and monitoring infrastructure makes DevOps a pleasure.
$C With the growth of multi-chain ecosystems, the need for reliable and fast data handling has become critical. Chainbase offers a decentralized way of indexing and processing data, allowing projects to quickly access necessary information from different blockchains. The network operates at high speed and ensures data integrity thanks to its Web3 architecture.
$LA LA-token: not just a utility, but a key to decentralization 🧩 The LA token plays a central role in the governance of the Lagrange ZK network. Participants stake LA to participate in competitions for generating ZK proofs and receive rewards in the form of network fees. This model incentivizes the growth of decentralization and ensures a sustainable economy within the protocol.
🚀 Financial inclusion through Huma Finance HUMA opens access to loans for millions of people without a banking history or crypto capital. A stable income is enough — and the smart contract will issue a loan by analyzing income. This is a new level of decentralized lending, where the "safety net" is not important, but the potential income is. $HUMA
$TREE Risk analysis and derivatives like those of funds Treehouse provides risk analysis tools similar to those used by institutional funds. Integration with derivative protocols allows tracking positions, liquidation levels, PnL, and exposure for each asset. All of this is available in one convenient interface.
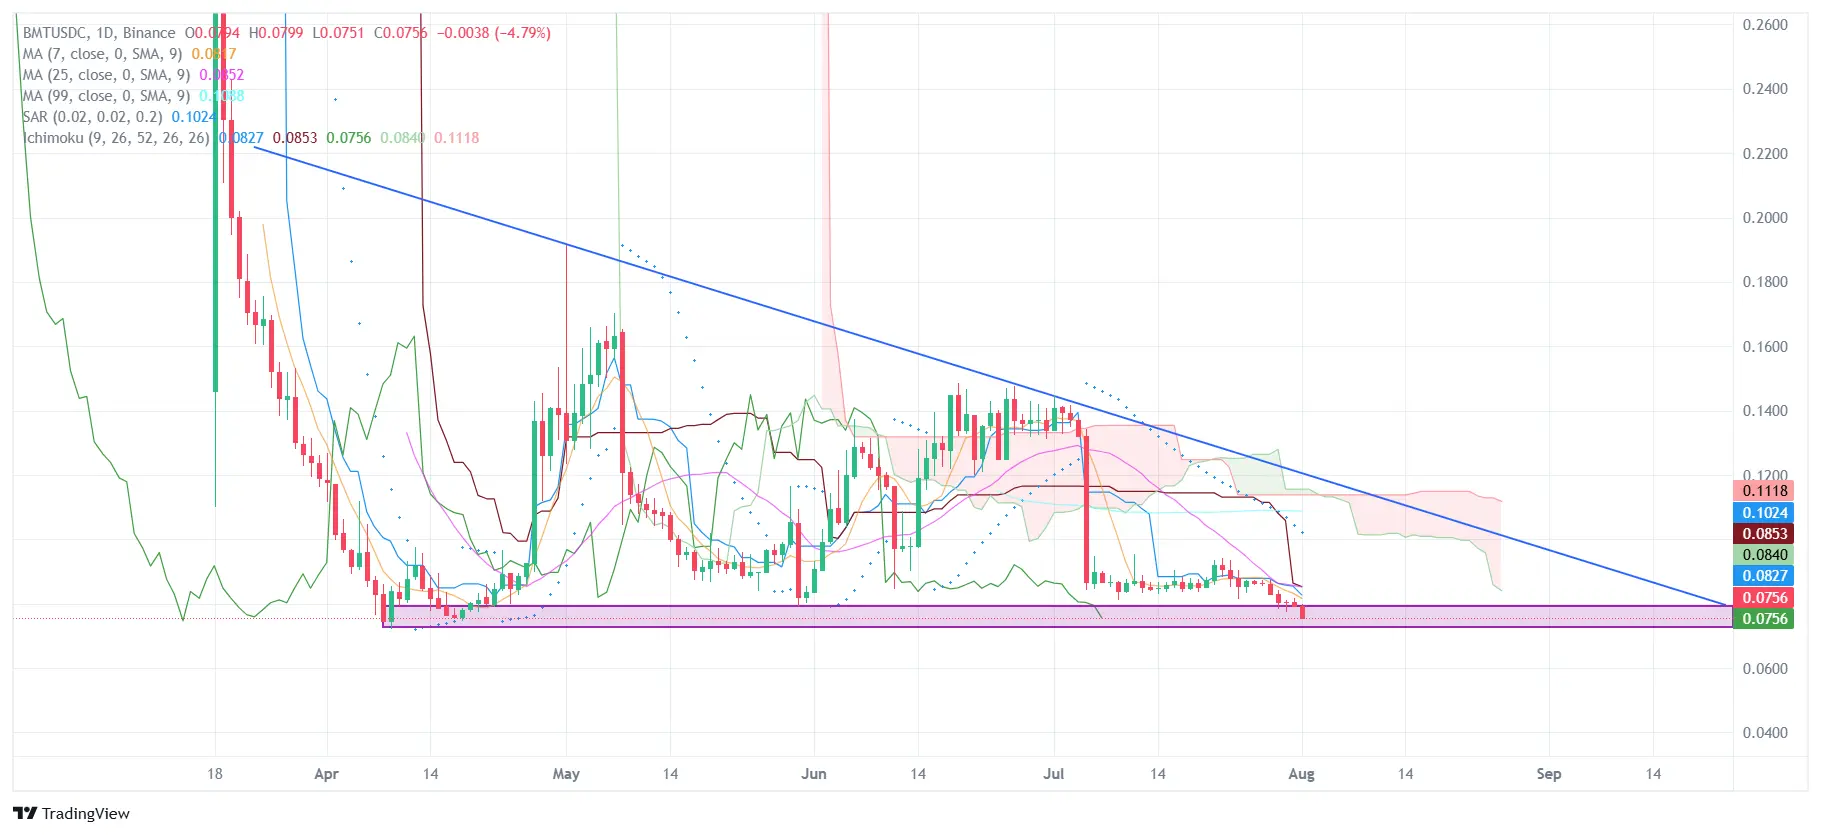
📉 Analysis of BMT/USD: attempt to hold the key demand zone 📊 On the daily chart of the asset BMT/USD, an interesting picture is observed: after a strong decline, the price found temporary support in the demand zone 0.0756–0.0853 marked in purple. Buyers are actively defending this level, as evidenced by repeated tests of support and a slowdown in volatility. Such a movement pattern may indicate accumulation, where large players are building positions before a possible reversal. 📊 If the asset stays above the level of 0.0756 and there is an increase in volume, this will be the first signal f
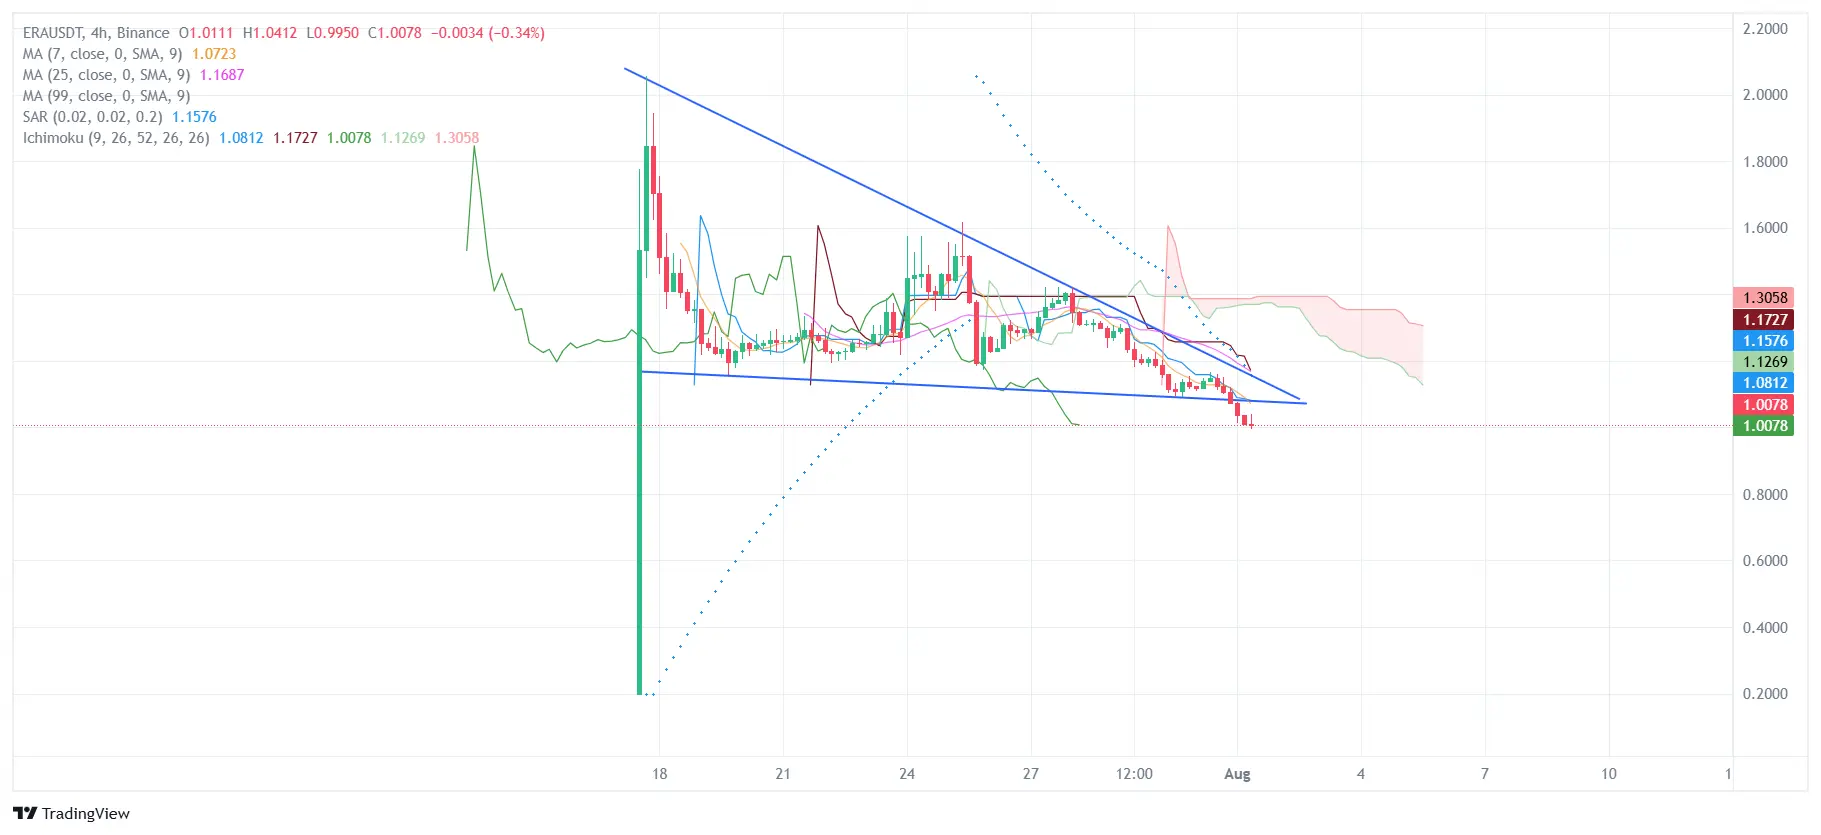
📉 Analysis of the asset ERA/USDT (4H timeframe) The chart shows that buyers could not hold the demand zone 🔽 around 1.172. The attempt to break upwards ended in failure — the asset faced strong resistance and started to decline. 🔺 The descending triangle ( marked by the blue line ) has been broken downwards, which is a bearish signal and indicates increasing pressure from sellers. The price is currently trading below the support line, which may indicate a continuation of the decline. 📊 The confirmation of the bearish scenario will be an increase in volumes during the decline. Watch the key
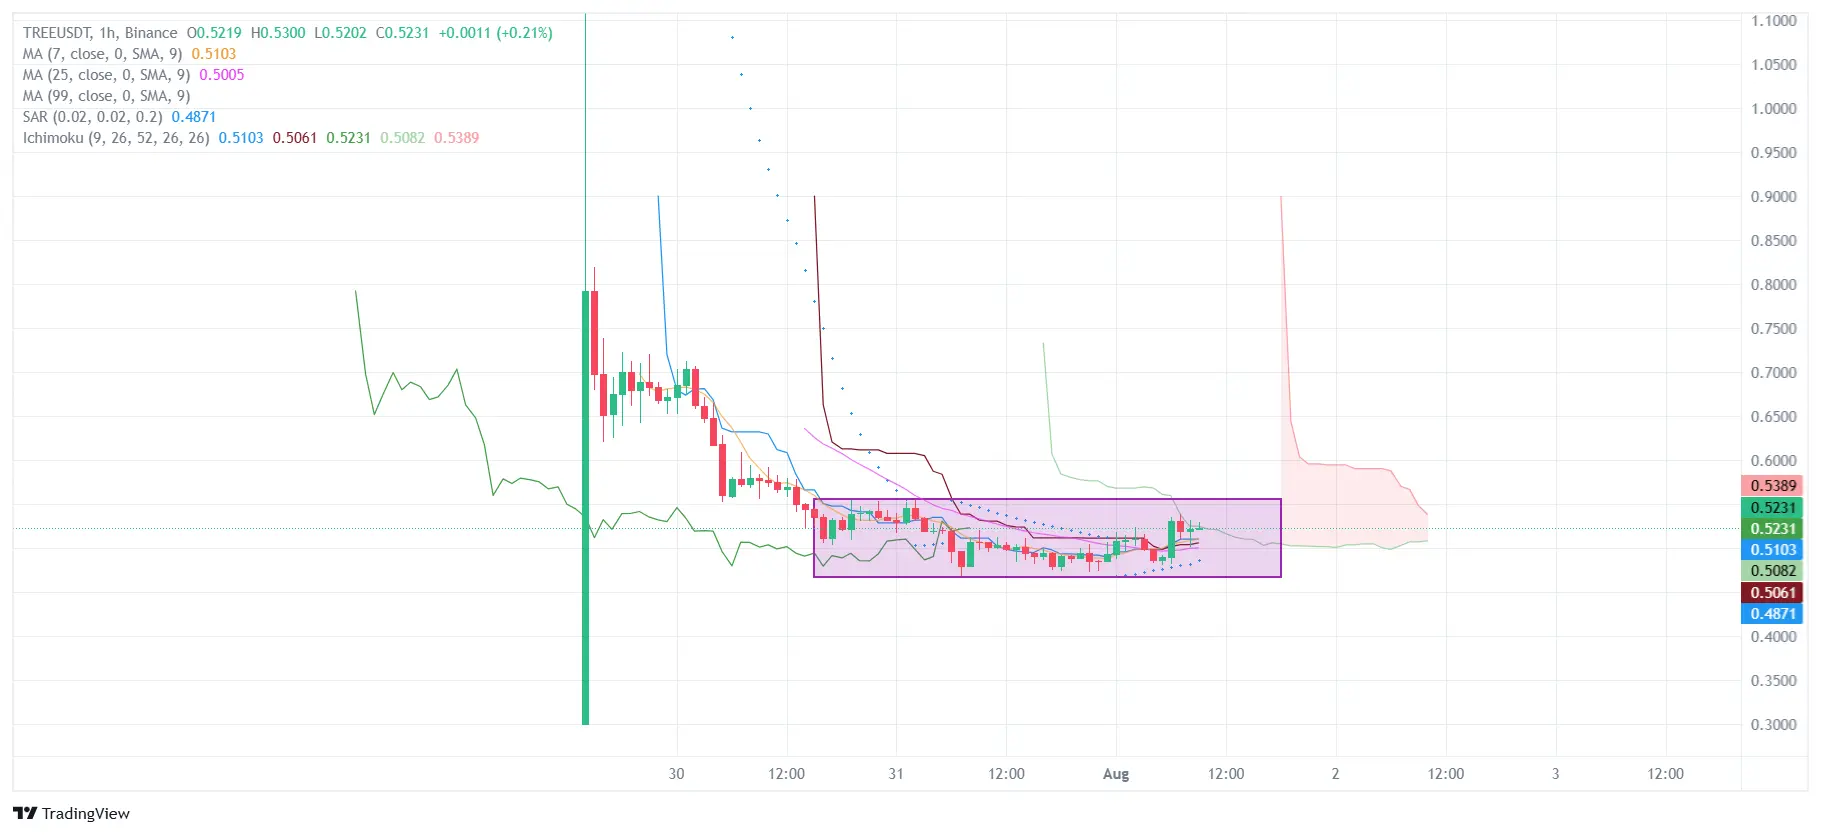
🚀 Analysis of TREE/USD: Is a breakthrough coming? 🧠📊 On the hourly chart of the asset $TREE, a 📉 cumulative consolidation is observed — the market has settled in the purple zone between 0.5061 and 0.5231 after a sharp decline. Such a phase of "stagnation" often precedes a powerful movement 💥. 📌 Key signals: 🔹 The price has stabilized and "compressed" into a narrow range. 🔹 The candles are getting smaller — this is 🔕 a decrease in volatility. 🔹 Ichimoku and MA are preparing for a potential crossover, signaling a possible trend change ⚡️. 📈 What’s next? 📤 Bullish scenario: breakout a